Material recognition with AI

Case
Work performed
- Automatically classifying & labelling the surface on orthophotos with a machine learning model
- Build a performant model within QGIS where the corresponding shapefile and orthophoto automatically split up the fibre trajectory in line segment with related surface material as attributes
Added value
- Saved a lot of time by eliminating the need to manually label every possible surface type (grass, concrete, asphalt, sidewalk tiles, …)
- Delivered a model that gets better through time as it learns from the fed data which increases the certainty of the model
- A clear overview of every surface type and its lengths with added internal costs considerably speeds up the process of defining the project scope
What was the problem?
Telecom operators invest lots of money in new fibre-optic networks for high-speed internet in cities worldwide, the so-called Fibre-to-the-Home (FTTH) networks. Most of the time, the new fibre cables used for these connections are underground, so many sidewalks have to be broken up during the network construction.
Sidewalks that are broken open for days are not only a burden for residents and passers-by. The telecom operators also want to deal with such works quickly. After all, breaking sidewalks cost money. That is why they map out the neighbourhood in advance and check how and where the cables can be installed the best, cheapest and fast way: what types of connections are needed, and how to reduce costs as the expected cost depend on the construction along the facade or underground with excavation work in various surface materials.
This mapping and site inspection process is also still consuming lots of time and money. It is currently done manually by driving and walking around different streets to map out all the elements.
At least, it was.
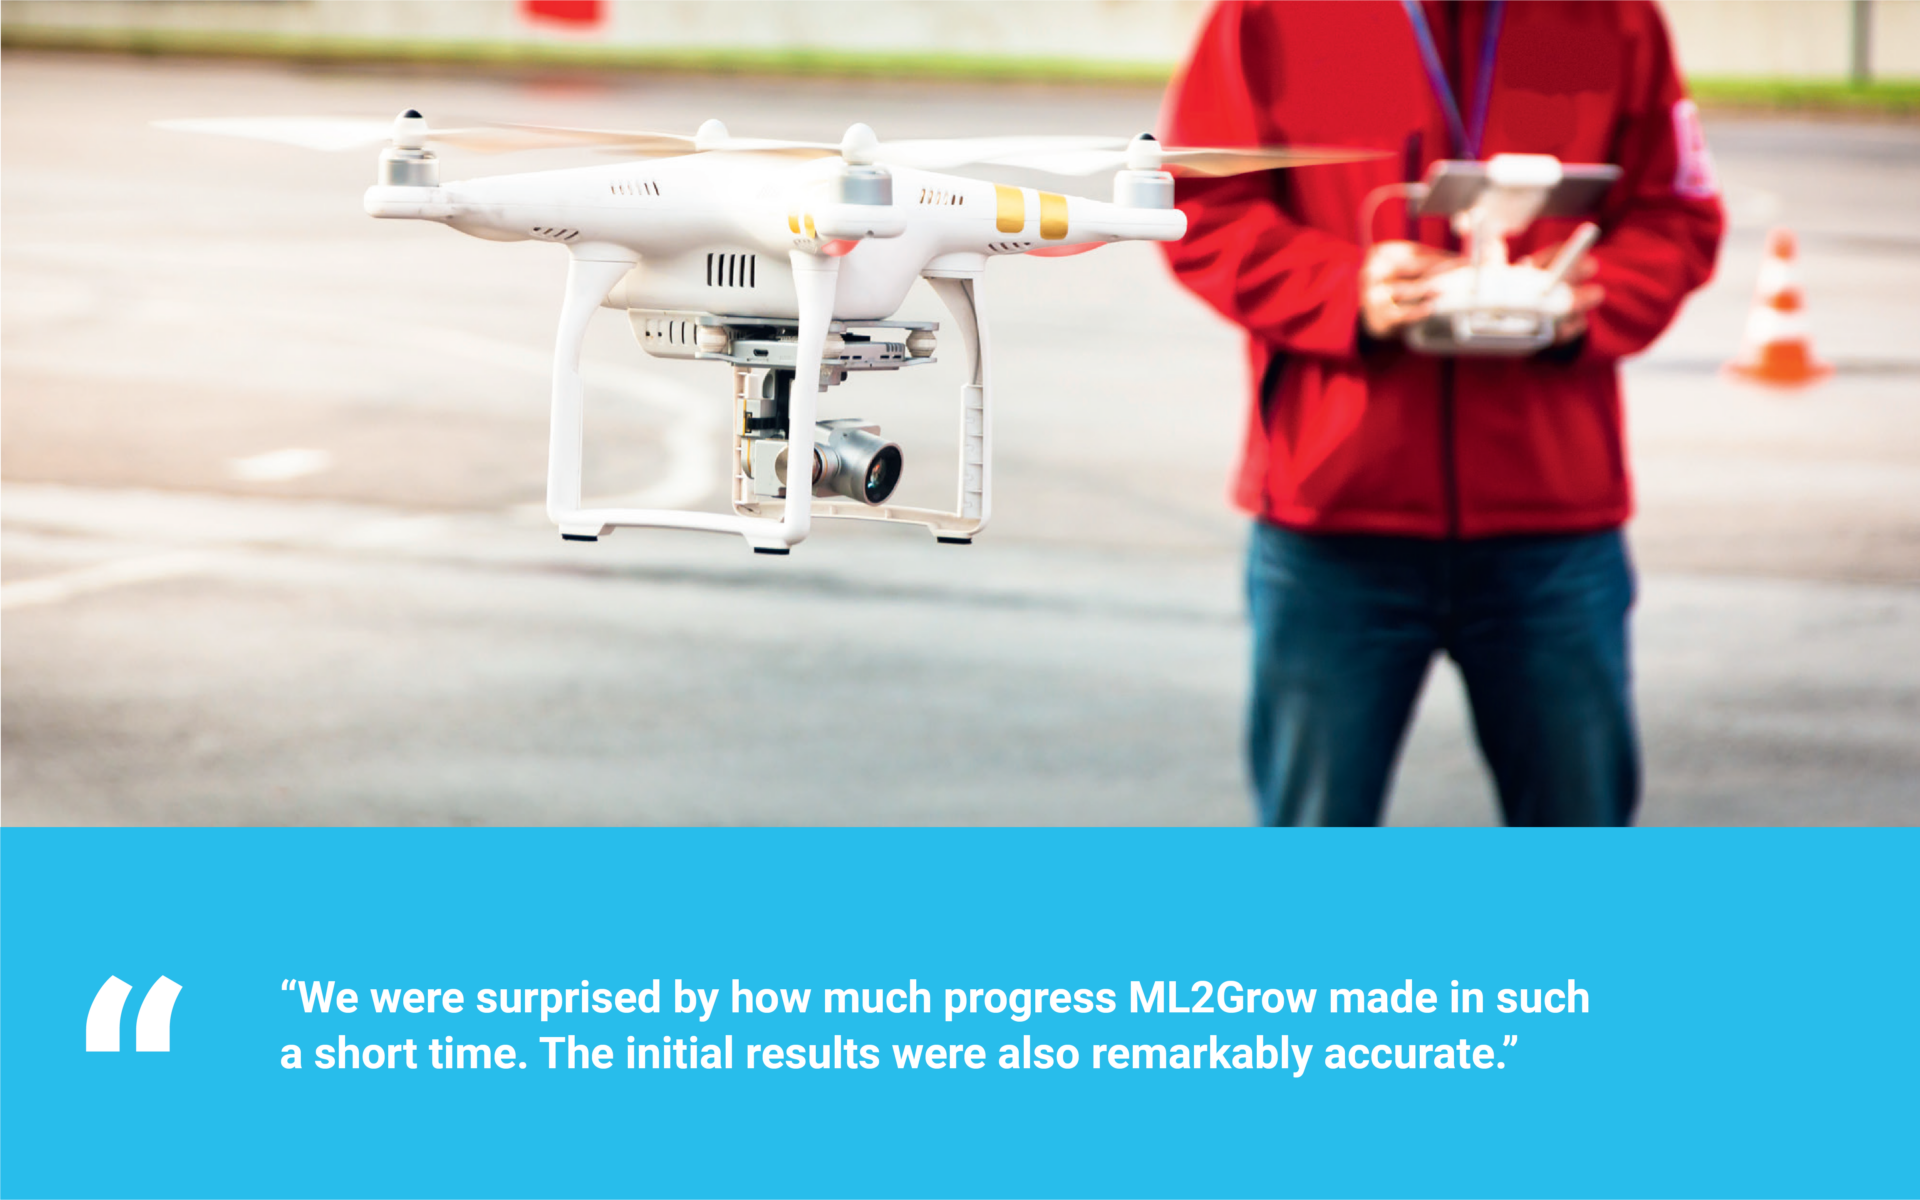
The solution : measuring sidewalks with drones & AI
Today we have the technology to speed up this process and reduce costs drastically. Therefore, drones are used to fly over the city, capturing all the needed details. Then our AI model trained on surfaces processes the images, following the path where the cables should be installed. The result is a clear list with numbers of kilometres according to the material of the path: grass, concrete pavers, concrete, plants. The computer knows how much work each type of soil requires to calculate the number of working hours and the associated costs.
This makes the whole operation more efficient and cheaper than previous methods to determine the project scope.
One of the companies that can do this work is FMT-office; they use pilots from INDROS for drone flights and process and calculate the orthophotos and check the data. They are currently active within the Fiberklaar consortium, building a new open fibre network that various telecom operators will use.
They appealed to ML2Grow for our experience in Deep Neural Networks and advanced software engineering to succeed in this co-creation project.
QGIS, an open-source tool
Recognizing materials on sidewalks is no small feat, especially given that you are filming from a certain height and there is also a lot of image noise. For example, vegetation over concrete or cobblestones can extend from a driveway to the street. You can also have trees and other objects blocking the view, such as bus stations. Changing daylight circumstances also have an impact on this process.
So, how do we tackle this?
First, we need to define and map out the neighbourhood where the client will install the fibre optics. Therefore, the telecom operator provides a georeferenced (QGIS) shapefile with the proposed location of the several cables (BIS-lines and HAS lines for respectively the backbone infrastructure and individual home connection lines) and the proposed type and location of the connection points. In QGIS, this shapefile can be shown as a separate layer on top of the land registry plan with the streets, sidewalks, buildings, and typology (house, apartment block, garage) obtained from open data libraries of the responsible governments.
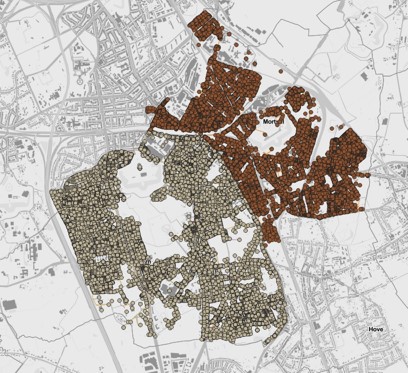
An example of a shapefile is to see the lines of the planned optic fibre cables and connection points.
QGIS is a free and open-source geographical information system for creating, editing, and annotating maps and spatial data. It is a tool well known in the mapping and geodata community, with many developers continuously improving the software.
As a vendor-neutral solution-builder for our customers, we believe in the power of open source as a means to kickstart projects by using building blocks that are the results of the joined efforts of thousands of developers from several small and large companies actively using this software in their environments. It enables small and midsize companies like ours to stand on the shoulders of giants and virtually extend our development team with developers from all over the world, reaping the benefits of these building blocks together. And above all, they are built on open standards, which is vital for openness and interoperability in ICT systems. ‘Open source’ stimulates transparency and, therefore, open competition in delivering added value to the customer’s specific needs.
And above, the openness of QGIS also results in extensive integration possibilities, which we also exploit in this use case.
Orthophotos
We now have a map with important information such as streets, sidewalks, buildings and typology. But, we need aerial photos of the area to classify the surface material along the fibre line or even train or use an AI model to do this automatically. Orthophotos are an excellent solution for this. These are aerial photographs or satellite imagery geometrically corrected such that the scale is uniform; the image follows a given map projection. Unlike an uncorrected aerial photo, an orthophoto can be used to measure proper distances because it accurately represents the Earth’s surface, having been adjusted for topographic relief, lens distortion, and camera tilt.
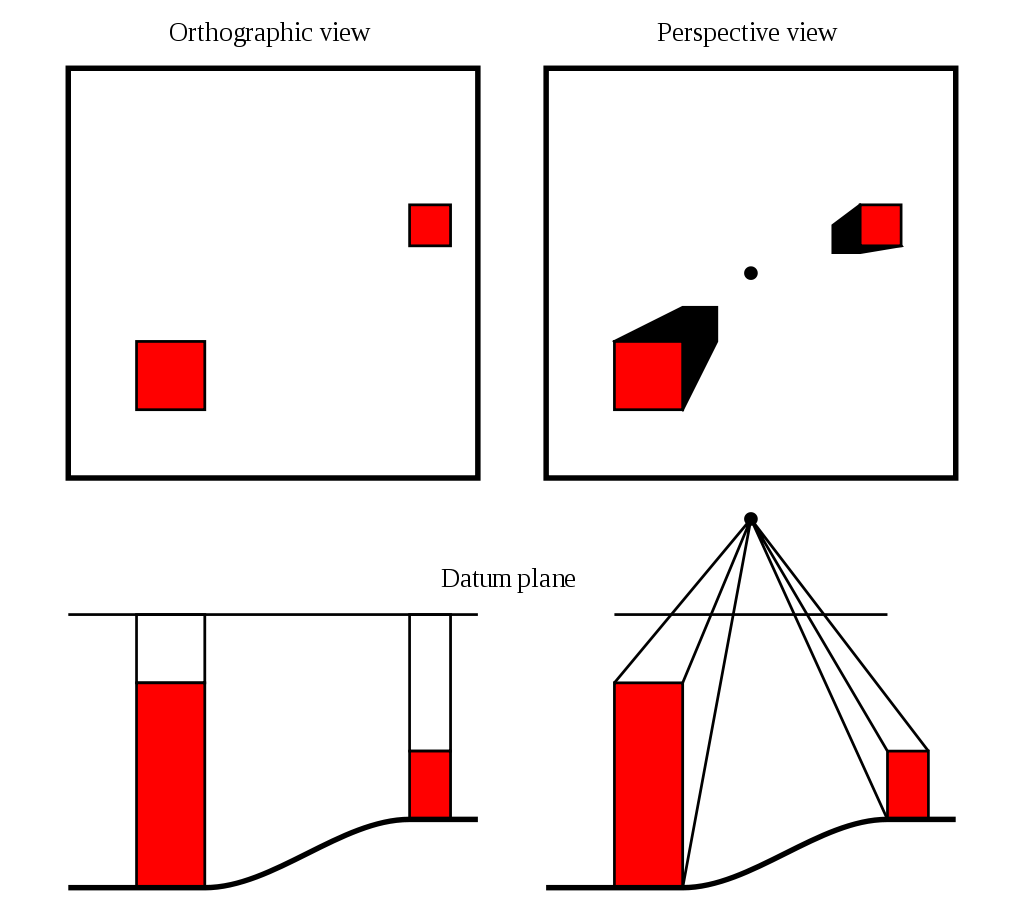
Orthographic views project at a right angle to the data plane. Perspective views project from the surface onto the datum plane from a fixed location.
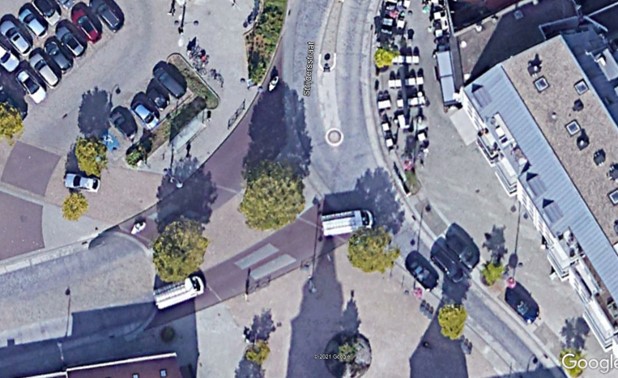
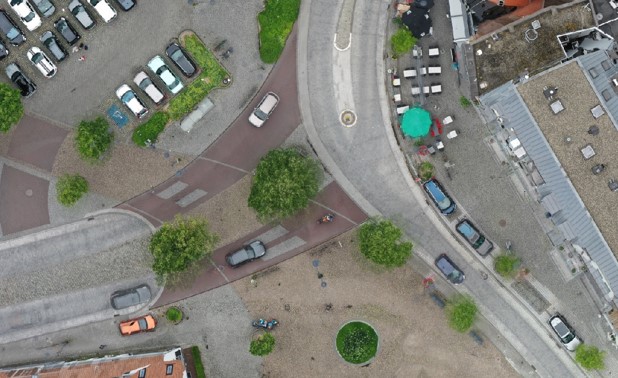
Here you can see the difference between a google maps image versus an orthophoto taken by a drone.
Shapefile
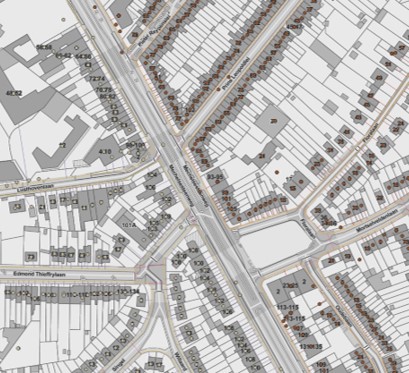
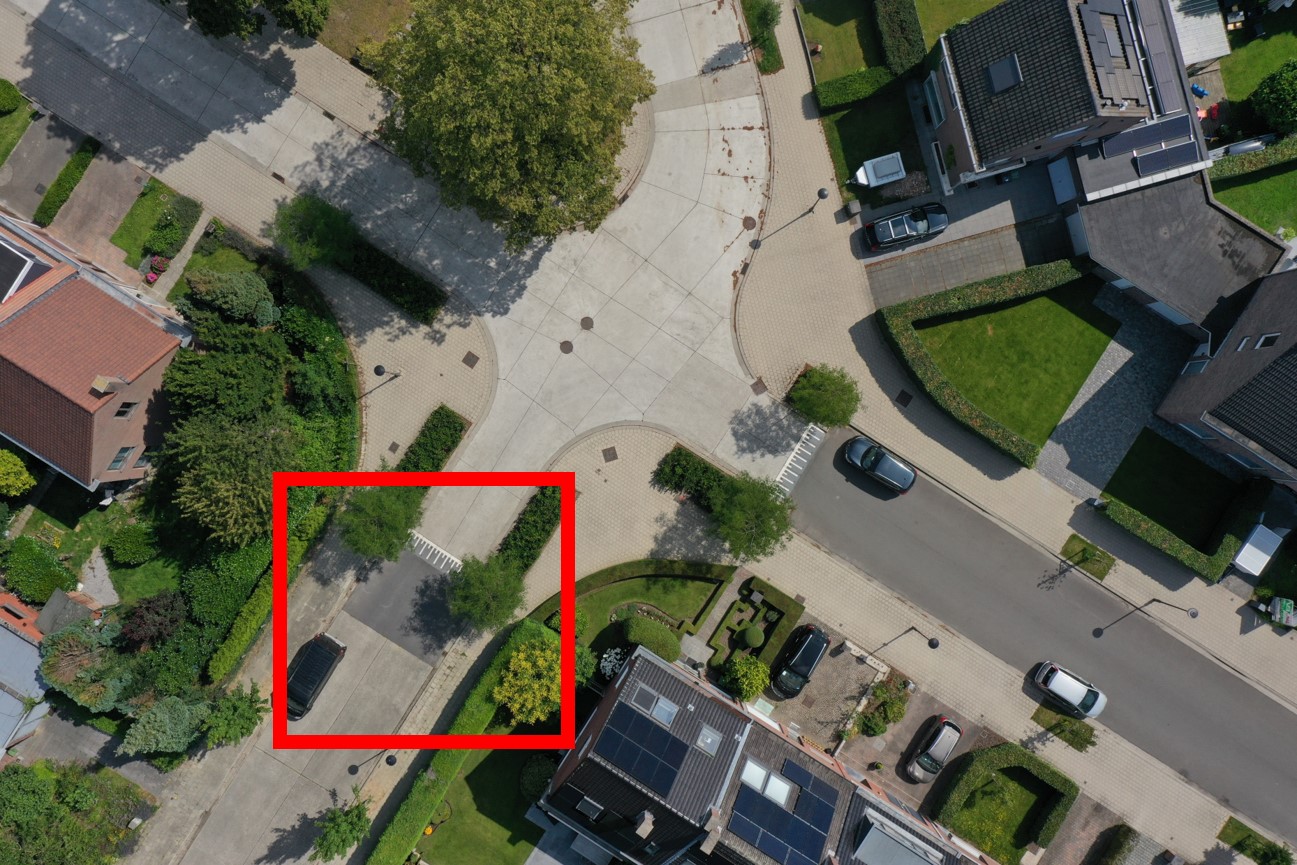
After importing the orthophotos in QGIS, we can start drawing lines along with the sidewalks, thus making a new shapefile. A shapefile is a simple, nontopological format storing geographic features’ geometric location and attribute information.
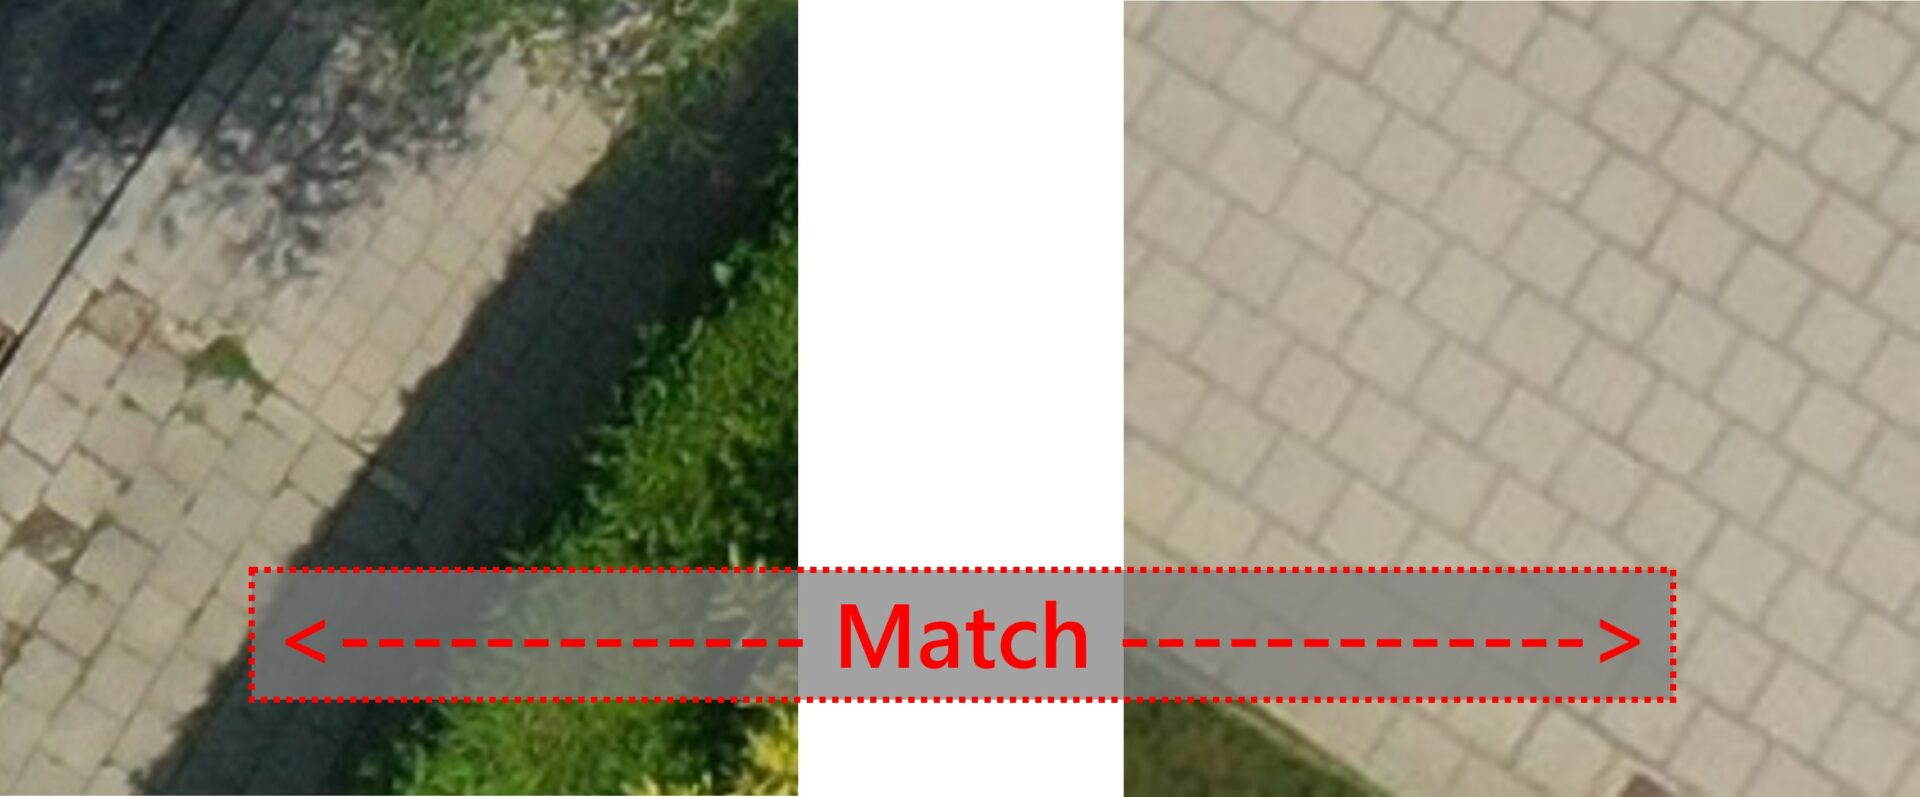
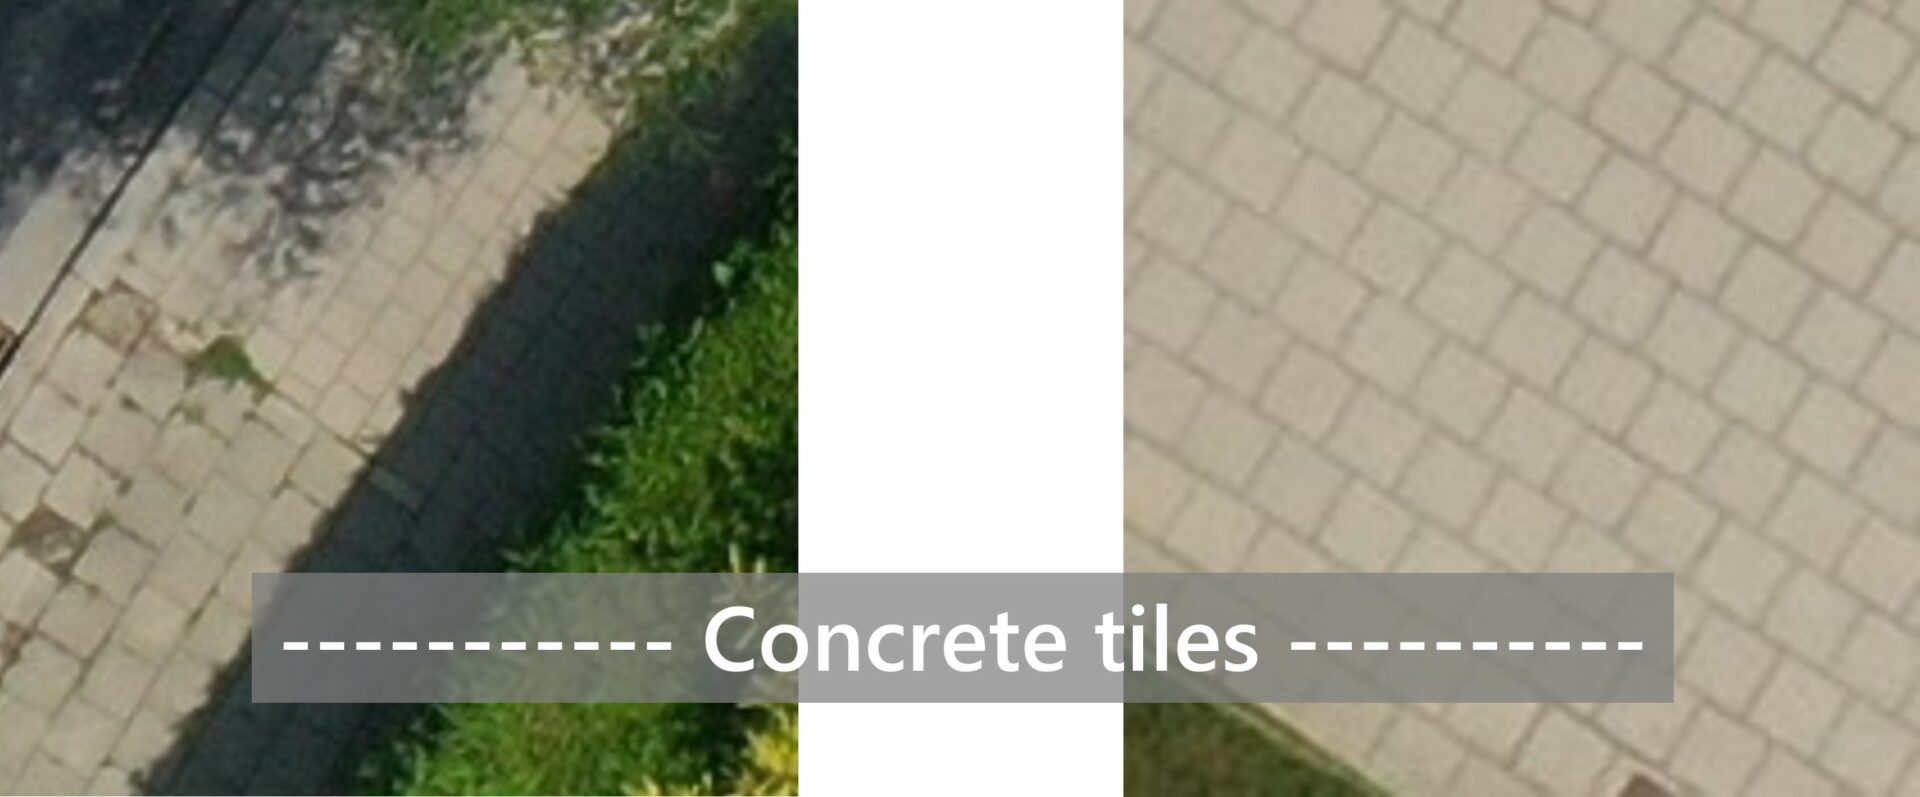
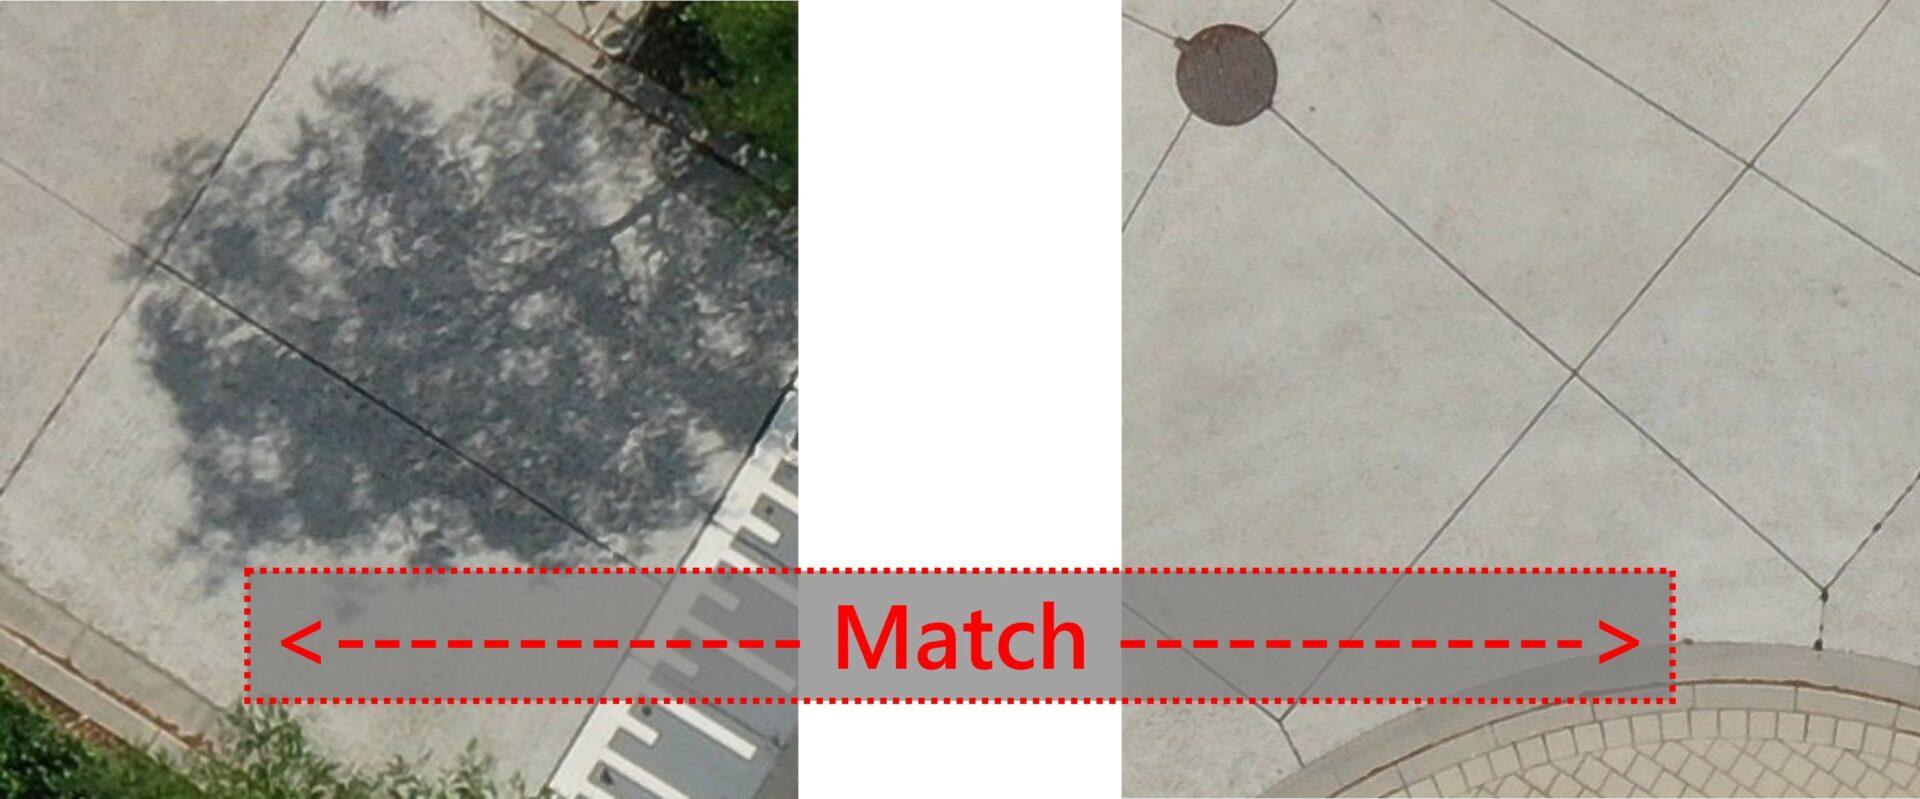
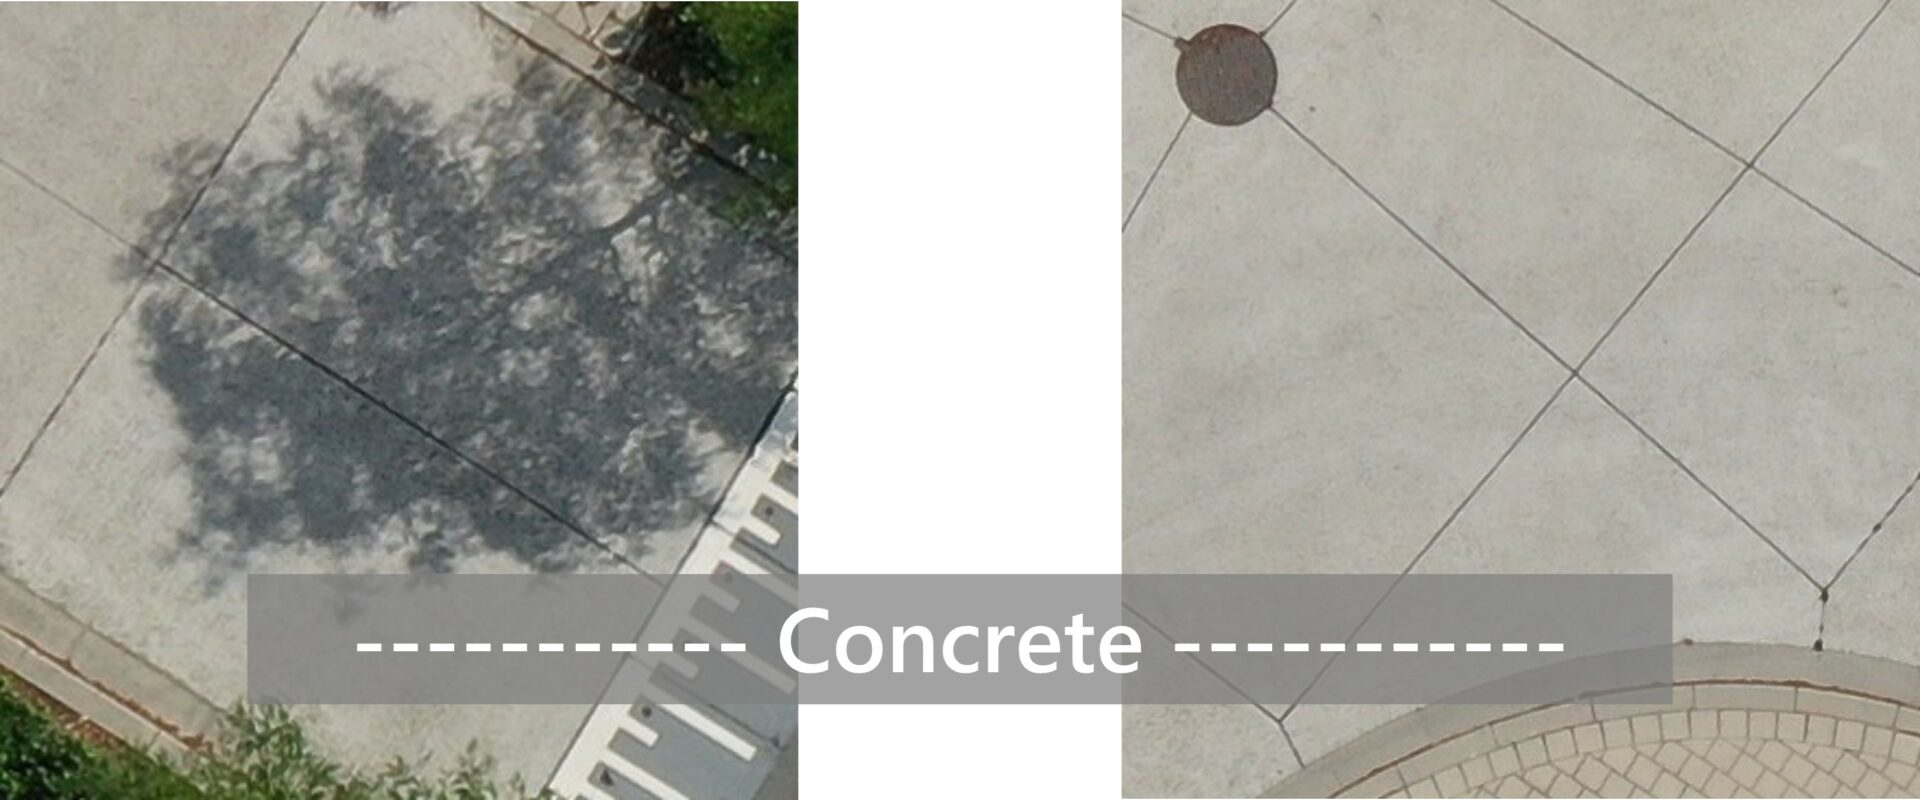
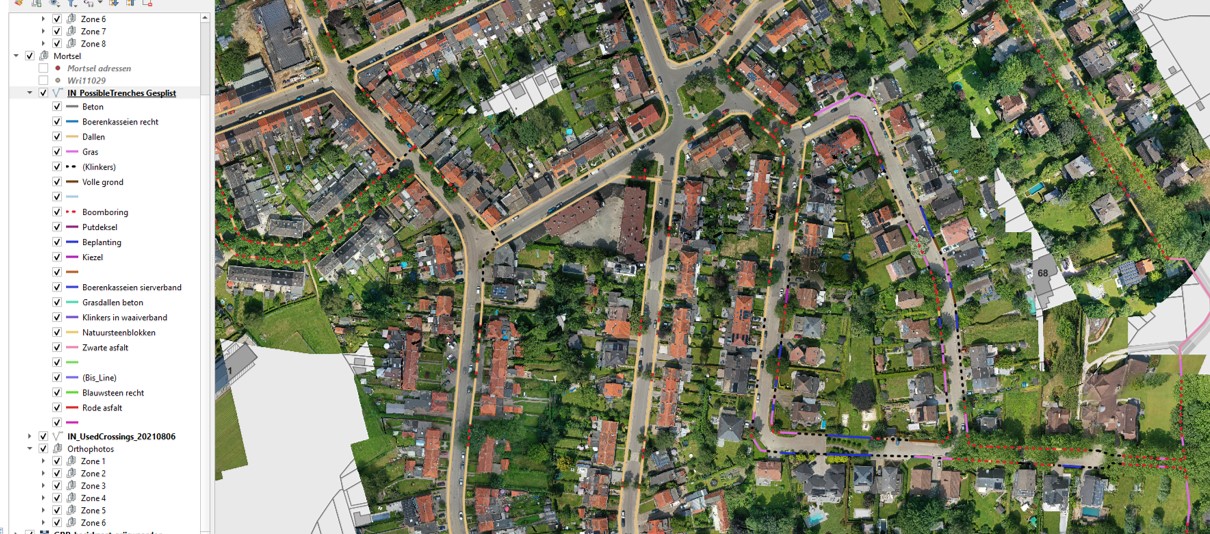
As you can see in the example below, we break every line into points to highlight the area where the material shifts. Our lines in this new shapefile have an attribute referring to the surface material underneath it.
The problem is that manually labelling every possible surface type (grass, concrete, asphalt, sidewalk tiles with a bandage, sidewalk tiles against plaster, ornamental paving,…) along the whole fibre trajectory is time-consuming. Here we bring in the actual value by automatically classifying the surface with a machine learning model developed by our experts. This model is either a segmentation model or a moving classifier. The model gives each line segment a prediction of the recognized surface material. This prediction is probabilistic, in which each possible material is assigned a probability that is the degree of certainty of the model.
For line segments where the model is sufficiently confident of the surface type, this attribute is automatically and immediately assigned to the line segment. The uncertainty is, in that case, lower than an agreed threshold value. However, suppose the model isn’t confident enough, resulting in a certainty level below this threshold. In that case, the segment is labelled as “uncertain” for manual labelling in the standard tools, Autocad or QGIS or whichever tool can adjust georeferenced shapefiles. These manually assigned values can also be maintained for later retraining of the classifier to make the system permanently smarter after each run, thus further increasing productivity.
Guy Meyvaert, an excellent drone pilot and an architect and telecoms expert, in cooperation with FMT-office & INDROS, supplied us with some manually labelled shapefiles from earlier projects. We used these as training datasets for our AI model by writing code to feed the right segments of these historical orthophotos along the labelled line trajectory into the training pipeline of our model.
After lots of artwork from our engineers, we ended up with a performant model called from within QGIS with the corresponding shapefile and orthophoto open to automatically split up the fibre trajectory in line segments with related surface material as attributes.
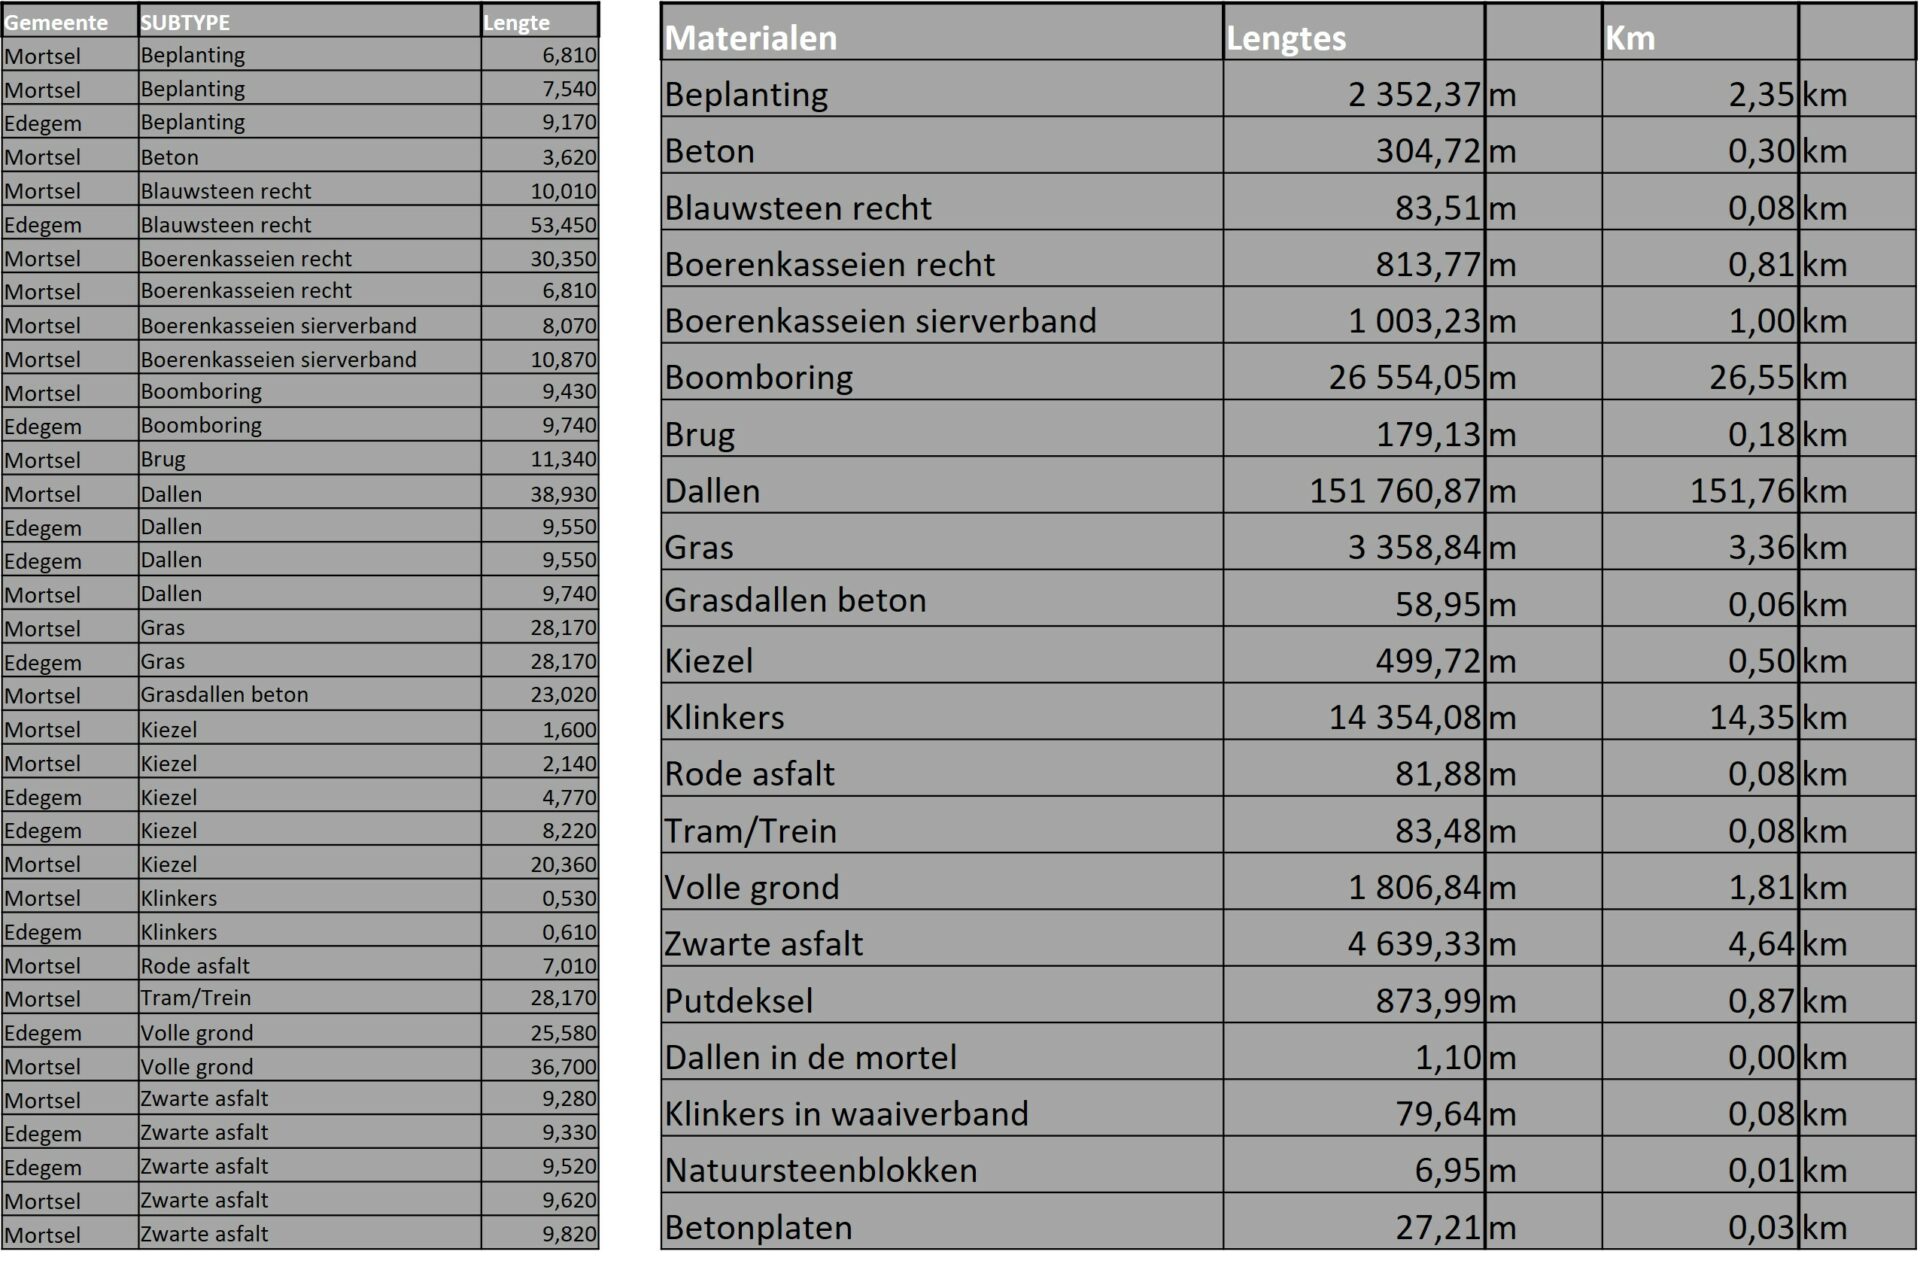
The tool will label all the types of surface materials in the QGIS-file, making it very easy for the user to assess the situation.
Finally, it will be possible to have a clear overview of every surface type and its length. Every type of surface will have an internal cost added, considerably speeding up the process of defining the project scope.